
When you think of Business Intelligence (BI) and Automation, the names that come to mind most often are Microsoft Power BI, Power Automate, Fabric, Tableau, Looker Studio. However, other powerful solutions exist outside of the Microsoft ecosystem. Among them: KNIME Analytics.
What is KNIME Analytics?
KNIME is a platform Open source oriented towards data science, automation and advanced analytics.
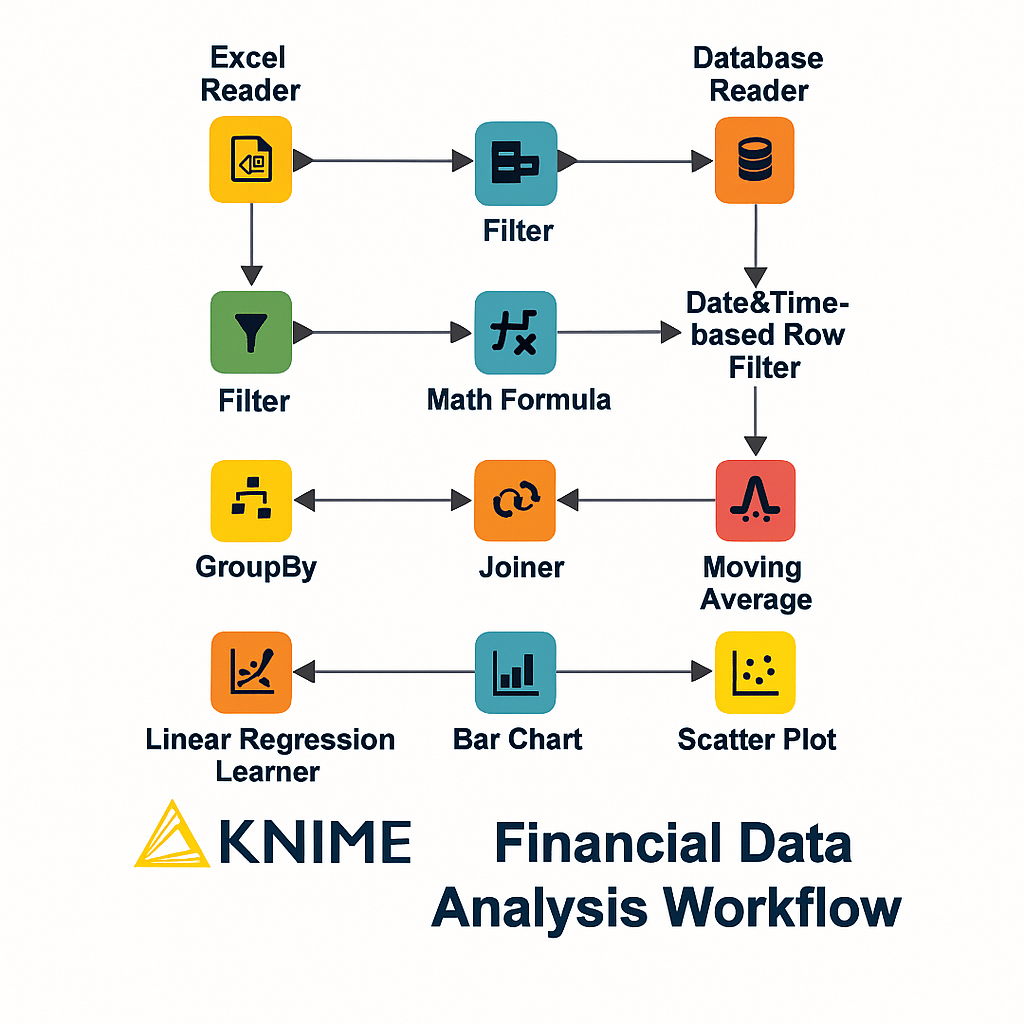
What's its particularity? It is based on a visual approach such as Workflow, where the user builds his processes by connecting “nodes” representing actions (importing, cleaning, transforming, analyzing, modeling, etc.).
Without writing a single line of code, it becomes possible to set up complex processes on large volumes of data. Pretty good for an ETL tool.
Key features of KNIME
- Data preparation and transformation : cleaning, joins, aggregations, enrichment from multiple sources (Excel, SQL databases, APIs, etc.).
- Advanced analytics : integration of machine learning models and statistics.
- Workflow automation : possibility of planning and industrializing processes.
- Multiple connectors : opening up to databases, business applications and cloud solutions.
- Open source : an active community that is constantly enriching the library of available nodes.
KNIME vs Power BI: two different approaches
- Power BI focuses on visualizing and the steering. Its strength is to offer an integrated experience that can be directly exploited by a financial department that seeks to analyze its figures quickly.
- KNIME, on the other hand is more positioned on the data preparation and modeling: it is by definition above all an ETL (Extract Transform Load) tool. Where Power BI simplifies the creation of dashboards, KNIME makes it possible to go further in complex data transformations or the integration of predictive models.
In reality, both tools can be complementary : KNIME for advanced preparation and workflow automation, Power BI for visualization and distribution to teams.
And in a financial department, in concrete terms?
- In an SME : Power BI is often the first choice. It is quick to get started and its dashboards allow you to obtain a clear vision of turnover, cash flow or budget in a few clicks. However, KNIME can find its place to automate certain complex flows (for example, importing data from multiple ERPs or heterogeneous files).
- In a large group : KNIME is becoming particularly interesting. Financial departments often handle massive volumes of data from multiple systems, requiring advanced transformations. Here, KNIME can serve as a “engine” for preparation and automation, before pushing data into Power BI for analysis and dissemination.
Conclusion
At Apage, we work primarily with the Microsoft ecosystem, as it meets the needs of the majority of our customers. But we also enjoy working with other tools such as KNIME Analytics. It also means recognizing that Business Intelligence is a rich field, where open source and innovation offer interesting perspectives.
For a financial department, the choice between Power BI and KNIME should not be seen as an opposition, but as an opportunity to explore complementary solutions according to needs: speed and visual control on the one hand, flexibility and automation power on the other.